Energy Monitoring: 2022 Edition
I started monitoring my energy usage last year out of curiosity, but with how prices have risen this year, it feels less like a “this would be fun to know” situation and more of a “where are we using energy that we shouldn’t be” situation now.
Update 1: This post only covers electricity usage, my gas monitoring is minimal and not what I’m focusing on for this post, maybe in the future…
House usage
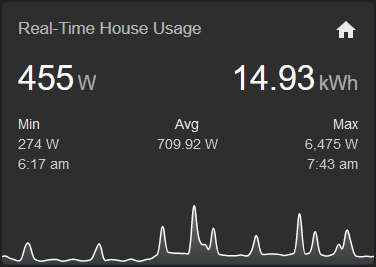
I have whole-home energy monitoring through the Glow In-Home-Display which gives me my electricity usage every 10 seconds and my gas usage every 30 minutes over MQTT. I’d prefer if it were purely local, but I’ll take what I can get.
EDIT: Thanks to Robin Hawkes on Twitter I learned that the Glow IHD now supports communicating with a local MQTT broker!
That previous blog post details how I got that running, so I won’t cover setting it up in this post.
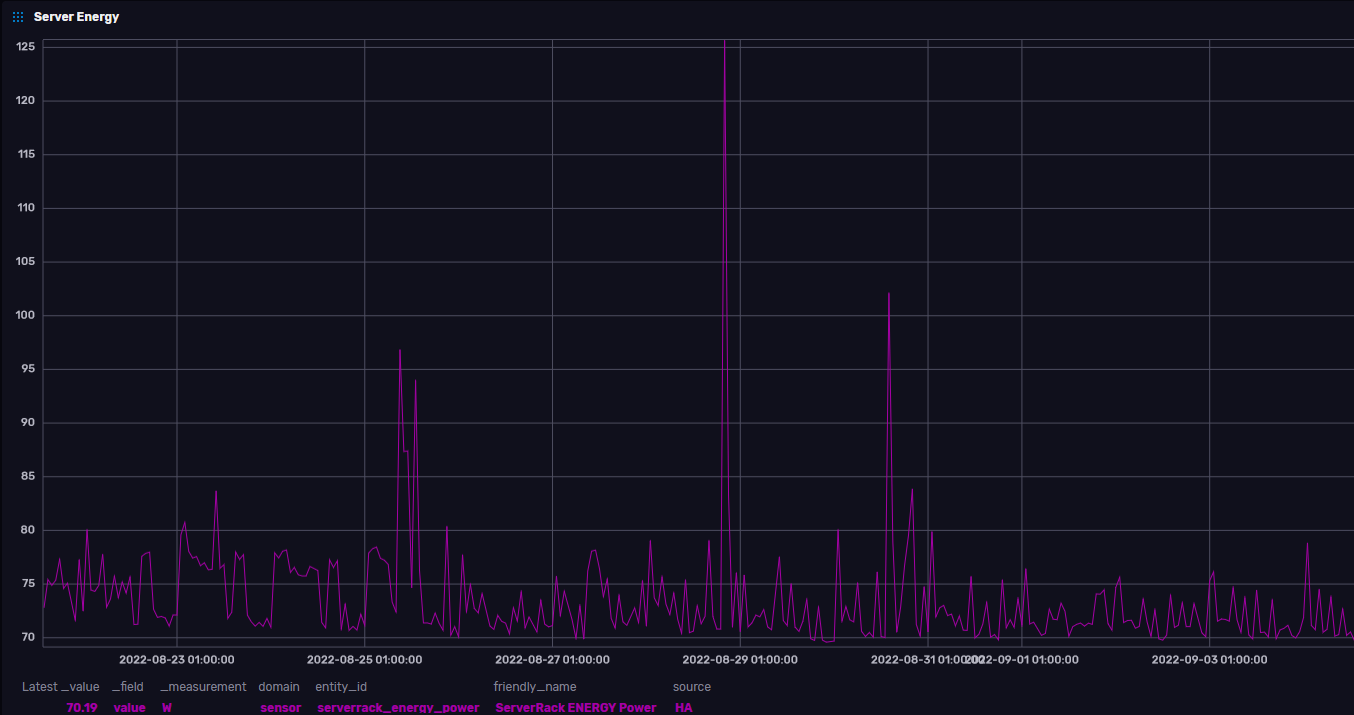
Here, have a nice graph showing you what it looks like on my dashboard, oooh shiny…
Device usage
I wanted to know more about specific devices, or things like my desk that I work from, what’s the power consumption of that when working with my work laptop powering things? What’s the consumption like when I’m playing a game on my desktop PC? What sort of energy does my server rack and network gear use?
I’d previously used some TP-Link plugs (I think they were HS100’s) that gave me some power monitoring locally, but TP-Link messed around with firmware and removed local API access, which didn’t go down well with the Home Assistant crowd. So I decided to look for an alternative.
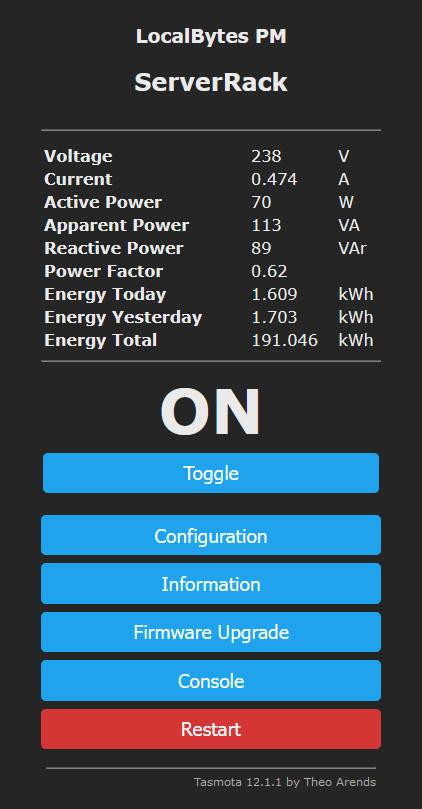
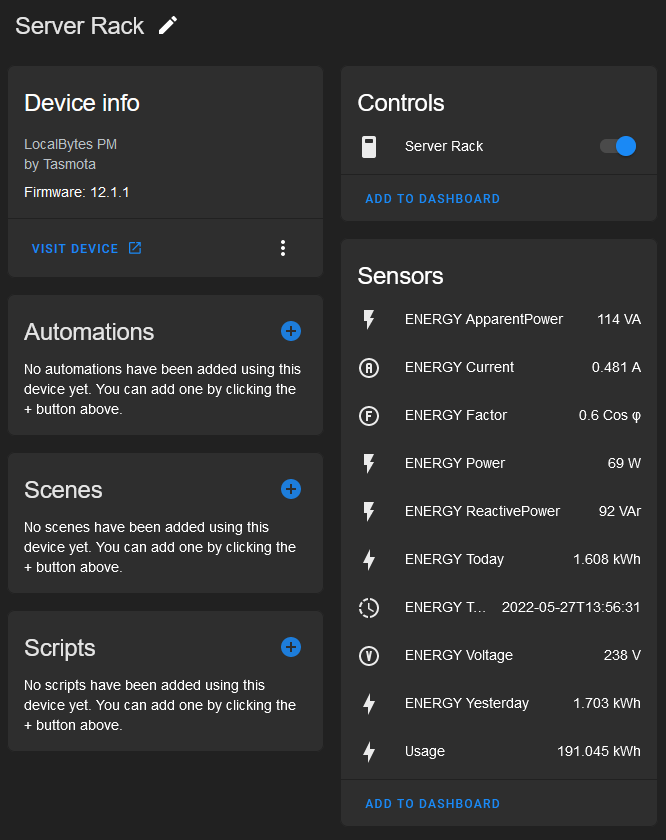
I found the Local Bytes Power Monitoring Smart Plug! It comes pre-flashed with Tasmota which is an open-source firmware for ESP-based devices that allows local control, and access to the data via MQTT, which is neat!
Setup was straightforward, plug it in, and it’ll broadcast an SSID to connect on. Connect to that and it’ll prompt you to enter the SSID & password of the WiFi network you want to connect it to. Once you’ve done that it’ll disconnect you from the network it’s setup and connect to WiFi. Then you can visit the IP address of the device in your browser to get things setup!
The early ones I have were only 10amp rated, but for what I would be running through them, it wasn’t an issue. The newer ones I have are 13amp rated which is nice though.
Once setup and on WiFi, I configured them to send their data to an MQTT broker I run locally.
I setup the Tasmota integration in Home Assistant and it auto-discovered each plug as I added it. Super slick.

Currently the 3 main stats I use are:
Power- the real-time usage of the plug in WToday- how much energy it’s used today in kWhTotal- which allows me to set the device as a monitored individual device within the energy dashboard
However, there’s many more stats that are reported into Home Assistant if you wanted to use any of those yourself.
Also note: because these are plugs, within Home Assistant by default they’ll be able to be turned on and off, using the command PowerOnState 4 in the console ensures that they can’t be turned off and will maintain an “On” state. I covered that in a post describing a couple of useful Tasmota Commands.
Granularity
I’ve got the plugs reporting their stats every 10 seconds (TelePeriod 10), which is fine by me (you could do less frequently if you wanted to avoid extra network traffic, as minimal as it is).
I’ve setup some things without individual devices monitored, but with a single plug for them all. For example, the power used at my desk. I don’t need to know the specifics of each device, I want to know what that group of things is using.
The way I achieve this is putting a plug at the socket on the wall, then connect the multi-plug adapter to that.
Some useful things to know about the things I monitor as a group are:
- The “Server Rack” power monitoring consists of:
- Synology DS920+ NAS
- ASUS PB60 thin client with an i5 9400
- Philips Hue Bridge
- Unifi US-8-60W Network Switch
- Unifi Flex HD Access Point
- The “Network” power monitoring consists of:
- UDM Router
- Virgin Media Super Hub 4
- Unifi US-8-60W Network Switch
- Raspberry Pi 4
- The “Reptiles” power monitoring consists of:
- Hylas’ heat bulb
- Hylas’ UV bulb
- Hubble’s heat bulb
- Hubble’s day UV bulb
- Hubble’s night UV bulb
- Mir’s heat bulb
- Mir’s UV bulb
- Mir’s heating mat
- The “Living Room Media” power monitoring consists of:
- TV
- PS5
- Chromecast
- HDMI Switcher
- IPTV Box
- Google Home Mini
- Nintendo Switch Dock
- The “Matt’s Desk” power monitoring consists of:
- Desktop PC
- Laptop
- 3 x screens
- USB Charging Hub
- Unifi US-8-60W Network Switch
- Unifi Flex HD Access Point
- Philips Hue Light Strip
- The “Matt’s Bookshelf” power monitoring consists of:
- Philips Hue Go Light
- Philips Hue Light Strip
- Standing fan
- Air conditioning unit (though not used right now as it’s not baking hot)
So when monitoring them, not all things will be on at all times, I could monitor each on individually, but day-to-day I’m not concerned with that. If I wanted to do more specific digging I’d do through each device one by one, but working out the PS5’s usage is irrelevant without the TV being on otherwise it’s not useful, so I’m fine with all these things via the one plug, it works for my needs.
That said, the reptiles is an interesting case, because Mir and Hubble are downstairs and Hylas is upstairs in my office, I wanted a single “Reptiles” stat, so I have 2 plugs with a template sensor that adds them together in Home Assistant:
- platform: template
  sensors:
    reptiles_energy_power:
      friendly_name: "Reptiles Energy Power"
      unit_of_measurement: 'W'
      value_template: "{{ (states('sensor.downstairs_reptiles_energy_power') | float + states('sensor.hylas_energy_power') | float) | round(0) }}"
    reptiles_energy_today:
      friendly_name: "Reptiles Energy Today"
      unit_of_measurement: 'kWh'
      value_template: "{{ (states('sensor.downstairs_reptiles_energy_today') | float + states('sensor.hylas_energy_today') | float) | round(2) }}"
But for some larger things, such as the fridge-freezer or washing machine, I want to monitor those individually. (Or the kettle to make Bojo the clown happy)
Graphs
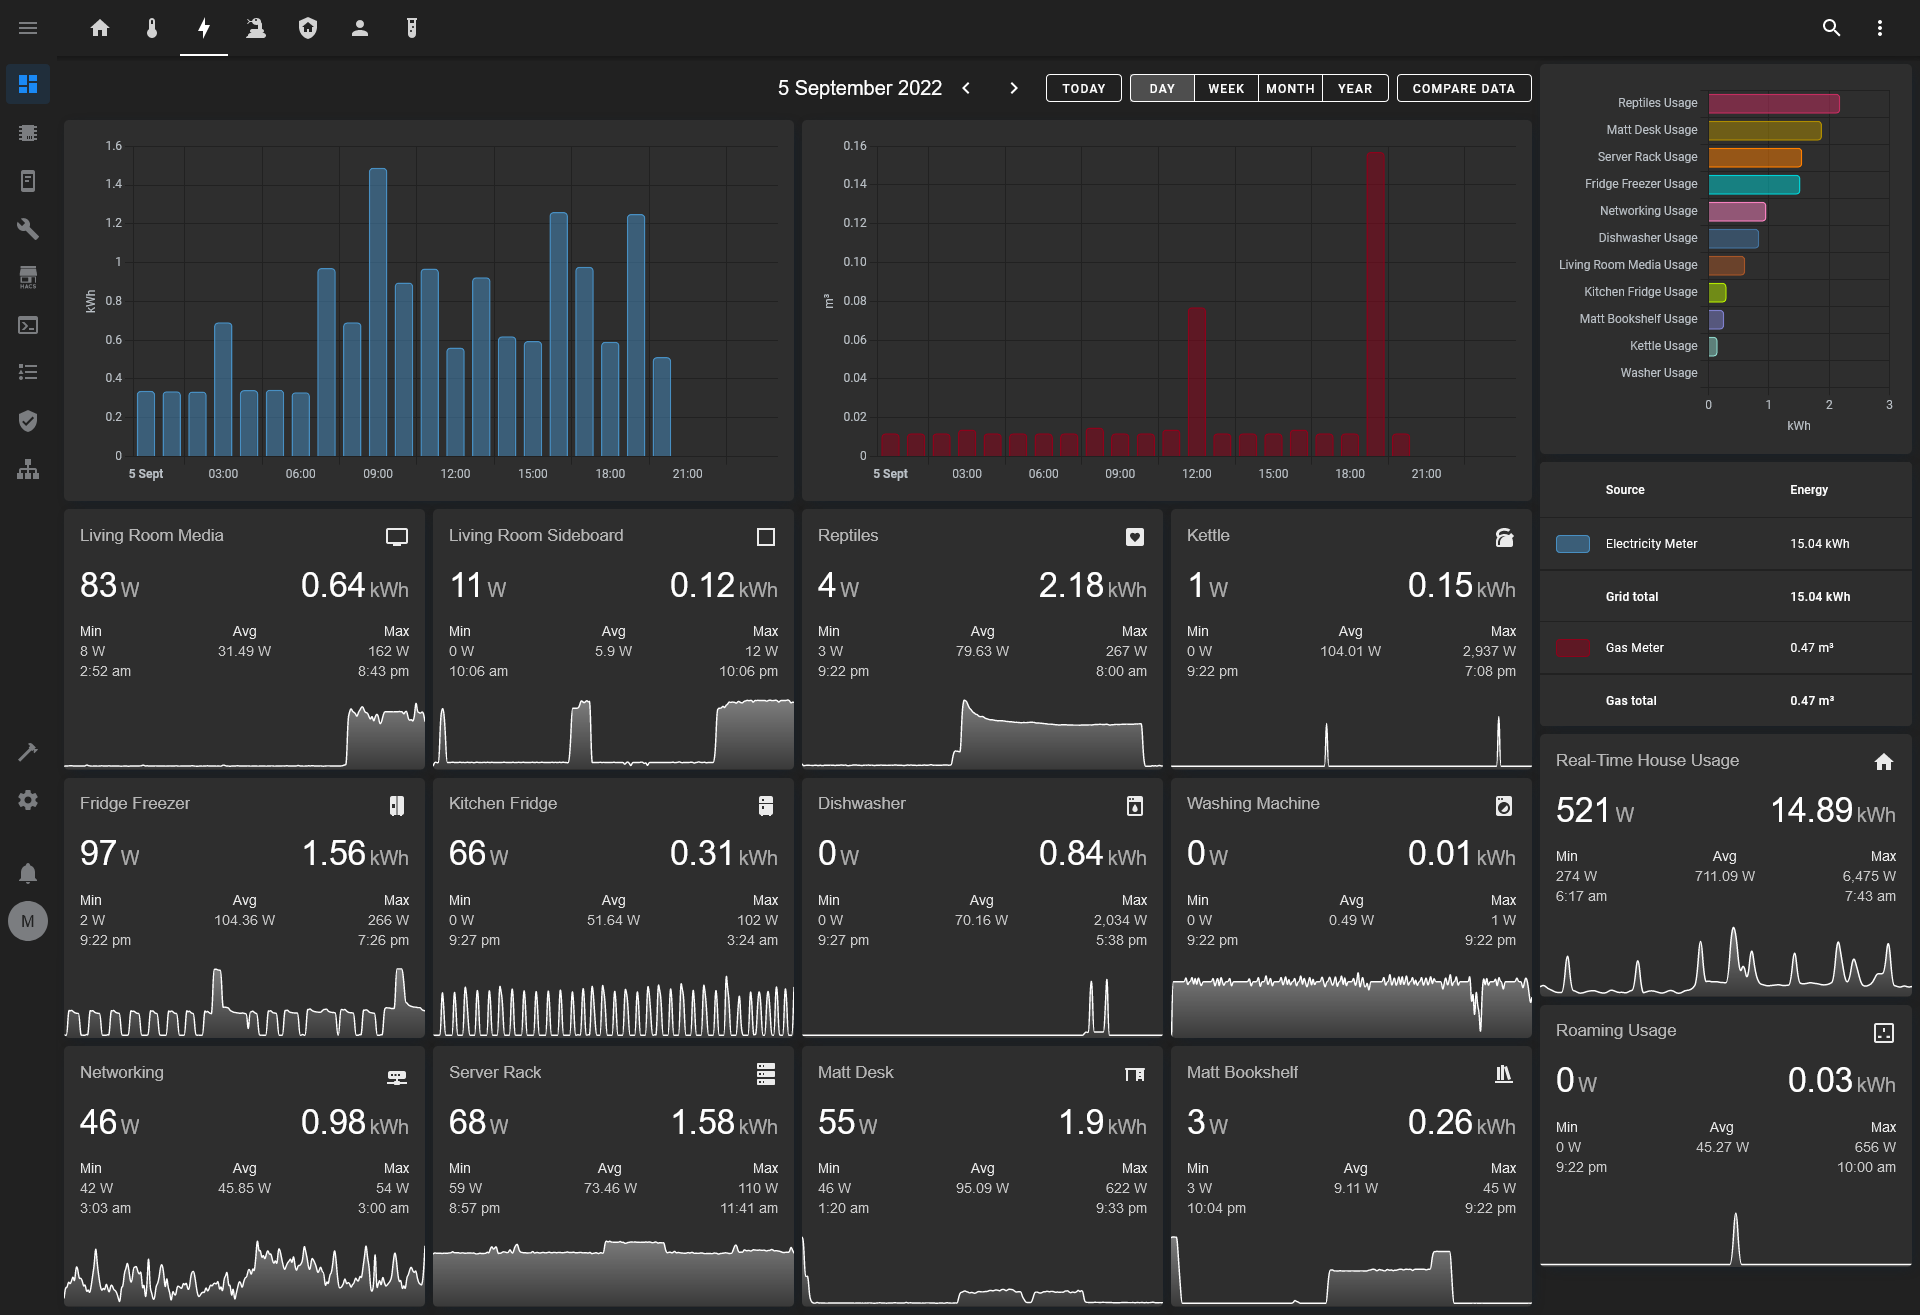
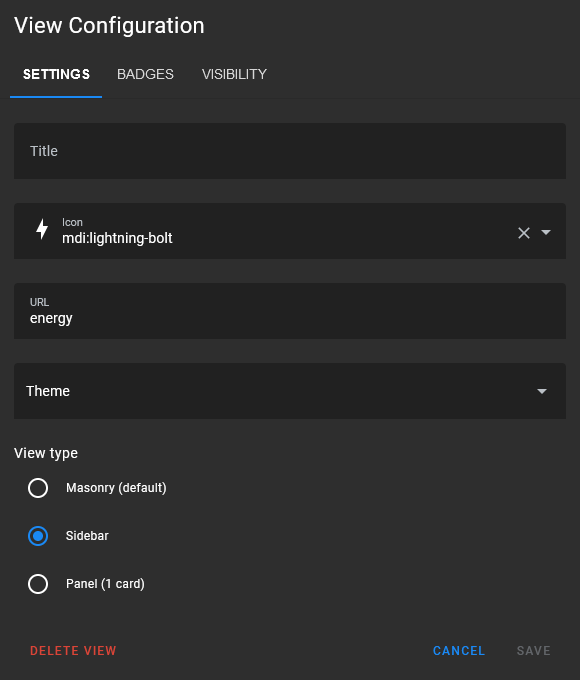
I have a custom energy dashboard view using the ‘Sidebar’ view type rather than the standard energy dashboard because I want the real-time usage and graphs for the devices / groups I’m monitoring too, and I can’t have those on the built-in energy dashboard.
But, with the energy cards I can include the energy data I want onto my custom view.
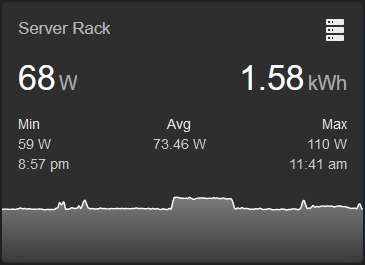
Each of the graphs for the devices / groups uses a Lovelace Mini Graph Card like so:
type: custom:mini-graph-card
entities:
  - entity: sensor.serverrack_energy_power
  - entity: sensor.serverrack_energy_today
    show_state: true
    show_graph: false
icon: mdi:server
show:
  extrema: true
  legend: false
  average: true
  fill: fade
name: Server Rack
line_width: 2
lower_bound: 0
min_bound_range: 100
points_per_hour: 10
line_color: '#fefefe'
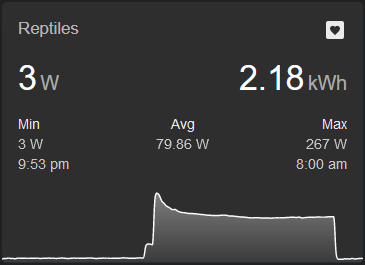
This would give you a single graph like so:
Combined with some horizontal stack cards and vertical stack cards you can get a nice grid like I’ve got above.
Analysing the data
I send the data into Influx DB which does run on a separate server, but there’s an addon for InfluxDB that you can install if you’re on a supported install method
So far I haven’t dug around with the data in InfluxDB much, as I haven’t had a need to - I’m monitoring what we’re doing at the minute, and the mini graphs are enough for my use case (yet)
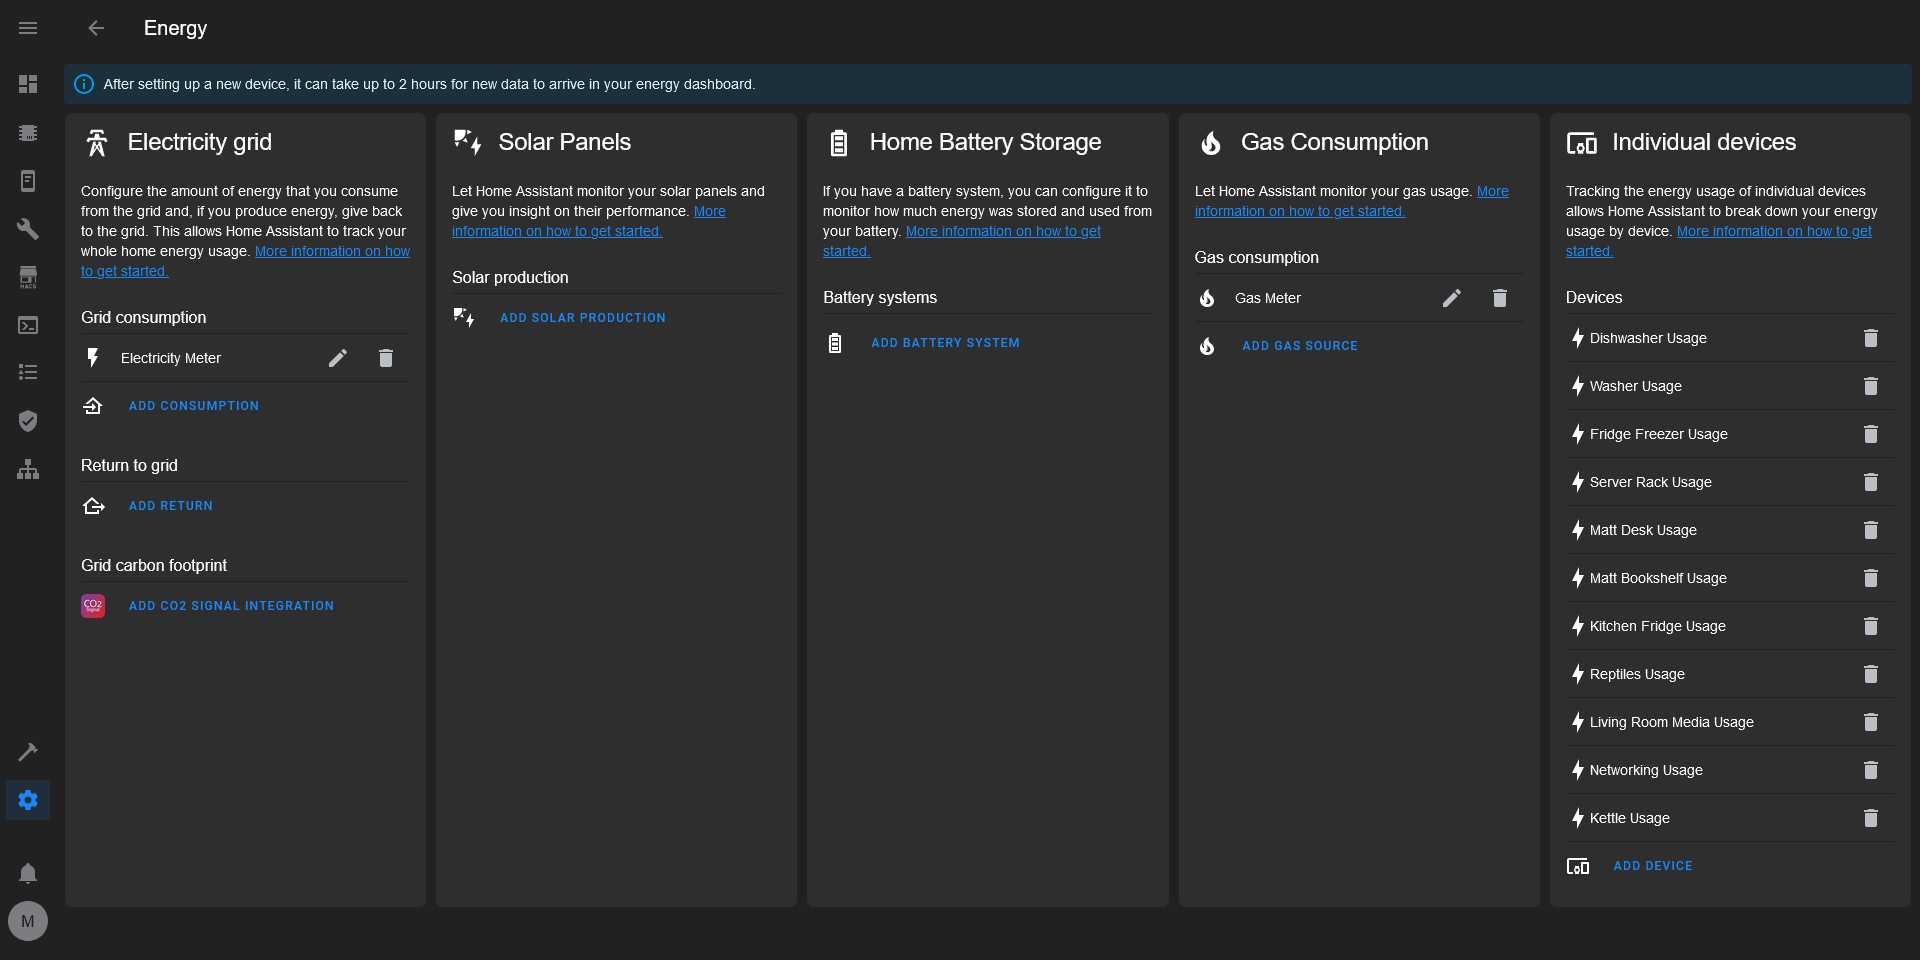
But using the individual devices functionality, I’ve gathered some stats over the past few days as an example of how daily usage can change depending on what you’re doing. I recently changed the way some monitoring works (combining reptile stats etc) so there’s only a few days. I have more from the past, but it doesn’t reflect things in their current state so the comparisons would be more tricky to do, and possibly unable to be done fairly.
Note: The total of the individual devices won’t add up to equal the overall electricity used as I don’t have power monitoring on every plug / circuit in the house, only the main ones I want to keep an eye on
Saturday 3rd September:
- Electricity used: 15.54 kWh
| Device | Usage (kWh) | Notes |
|---|---|---|
| Reptiles | 2.55 | |
| Matt Desk | 2.25 | Played games on my PC for a few hours |
| Fridge Freezer | 1.72 | |
| Server Rack | 1.71 | |
| Networking | 1.18 | |
| Living Room Media | 1.16 | |
| Kitchen Fridge | 0.29 | |
| Matt Bookshelf | 0.06 | |
| Washing Machine | 0.00 | |
| Dishwasher | 0.00 | |
| Kettle | 0.00 |
Sunday 4th September:
- Electricity used: 19.74 kWh
| Device | Usage (kWh) | Notes |
|---|---|---|
| Matt’s Desk | 3.38 | Played games on my PC for a few hours |
| Reptiles | 2.41 | |
| Fridge Freezer | 1.74 | |
| Server Rack | 1.70 | |
| Dishwasher | 1.51 | Run once on an “Intensive” wash |
| Washing Machine | 1.38 | Run once |
| Living Room Media | 1.30 | F1 race, YouTube videos |
| Networking | 1.09 | |
| Kitchen Fridge | 0.31 | |
| Matt’s Bookshelf | 0.22 | |
| Kettle | 0.11 |
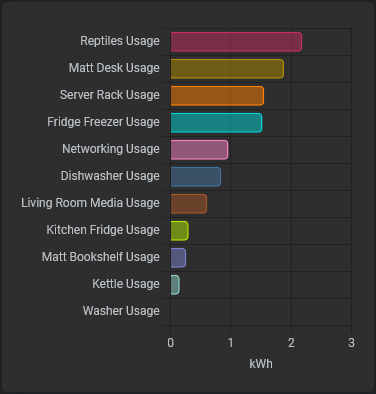
Monday 5th September:
- Electricity used: 16.72 kWh
| Device | Usage (kWh) | Notes |
|---|---|---|
| Reptiles | 2.20 | |
| Matt’s Desk | 2.05 | Only work today, no gaming |
| Server Rack | 1.76 | |
| Fridge Freezer | 1.76 | |
| Networking | 1.10 | |
| Dishwasher | 0.84 | Run once on an “Eco” wash |
| Living Room Media | 0.74 | Watched some TV together after work |
| Kitchen Fridge | 0.35 | |
| Matt’s Bookshelf | 0.27 | |
| Kettle | 0.15 | |
| Washing Machine | 0.00 |
Min, Max & Mean:
- Whole house electricity used: 17.33 kWh
| Device | Min Usage (kWh) | Max Usage (kWh) | Mean Usage (kWh) |
|---|---|---|---|
| Reptiles | 2.20 | 2.55 | 2.39 |
| Matt’s Desk | 2.05 | 3.38 | 2.56 |
| Server Rack | 1.70 | 1.76 | 1.72 |
| Fridge Freezer | 1.72 | 1.76 | 1.74 |
| Networking | 1.09 | 1.18 | 1.12 |
| Dishwasher | 0.00 | 1.51 | 0.78 |
| Living Room Media | 0.74 | 1.30 | 1.07 |
| Kitchen Fridge | 0.29 | 0.35 | 0.32 |
| Matt’s Bookshelf | 0.06 | 0.27 | 0.18 |
| Kettle | 0.00 | 0.15 | 0.09 |
| Washing Machine | 0.00 | 1.38 | 0.46 |
Cost to run
The system runs on a Raspberry Pi 4, this draws around 5-10W, which running 24 hours a day means it’s using 0.12-0.24kWh. So it’s not a lot at all.
I could count the ‘Network’ tracking I’ve been doing, but Home Assistant doesn’t need a fancy network setup, so I don’t feel like that counts towards it really.
Conclusions drawn & behaviours changed
The reptiles power draw peaks at the start of the day, because they’re going from night-time temperatures which are cooler, to heating up the basking spots to a high temperature, but once it gets up to temperature, the power draw tapers off to a lower level as it’s maintaining it at that temperature now:
My desk power draw when working (laptop + 3 screens) is 170-190W or so. When running a game (desktop + 3 screens) it’s up to 700W.
The server rack and networking setup consumes a significant chunk of our daily power, but it’s already cut down as far as I want without getting rid of it, which isn’t happening!
The dishwasher manual lists “Eco” wash as 0.73kWh consuption (I measured 0.84) and “Intensive” as 1.50kWh consumption (I measured 1.51) - so intensive washing is almost 2x as costly in electricity. Sometimes an intensive wash is needed but usually we run it on Eco mode so we’ll make sure we keep doing that!
We’re drawing around 17.33 kWH a day (average), this puts us above the ’typical’ usage in the UK, working from home, having reptiles, and running a small server rack do add up as our biggest uses of energy day-to-day.
A surprise was the kitchen fridge. It’s an under-the-counter unit, but that only uses 0.32kWh a day on average, neat! The bigger fridge-freezer is in the conservatory and is where we store most things, that’s about what I’d expect to be used.
Can we change anything?
Perhaps, but the bigger consumers of power for us being reptiles and working from home can’t change. We’ve discussed rehoming the reptiles before, but that’s not because of the cost (3 reptiles + a demanding puppy is hard y’all…)
My gaming PC consumes a fair bit of power, I could avoid using that and use my laptop or Steam Deck instead, but gaming is a fun experience for me and I want to run games at high resolutions, max settings, and with good framerates. So right now I won’t be cutting that back, I’ll stick a few quid more into the energy bill fund to cover that.
The server rack and networking could arguably be lowered. But the networking equipment is what allows me to have a stable and robust network at home. The NAS is useful and used daily. The ASUS PB60 that runs as the main compute server doesn’t run at high CPU load, and typically the usage is 10-15W (I calculated that by connecting it to a separate plug for a brief period so I could monitor it on its own, I don’t need to do that day-to-day). I could replace it with a Raspberry Pi to consume less power, but the i5 9400 with Intel Quick Sync is fantastic for transcoding media via Plex and so I don’t want to give that up.
The rest of the things we’re using are day-to-day living things. I could hand wash things instead of using the dishwasher, but then I’d be using more water and also I’d be grumpy because I hate washing up!
Our TV use isn’t over the top, the most it’s used is on a Sunday during Rawe Ceek so we’ll be watching the F1 for a few hours with maybe some YouTube before / after.
Overall, we’ve had energy efficient things for a while now anyway. Our lights are LED-based, they turn off automatically when we leave home, we don’t run everyday appliances needlessly.
There’s not a lot we’ll be changing right now. We’re lucky in that any increased costs we can absorb right now. Not that we want to, but to get costs down to where they’d be average or not far off what we’re paying now would mean sacrificing things that bring joy to our lives.